whereispatrick.at
A website to display GPS coordinates and geo-tagged photos on a single Google Map.
https://github.com/Freija/whereispatrick
Introduction
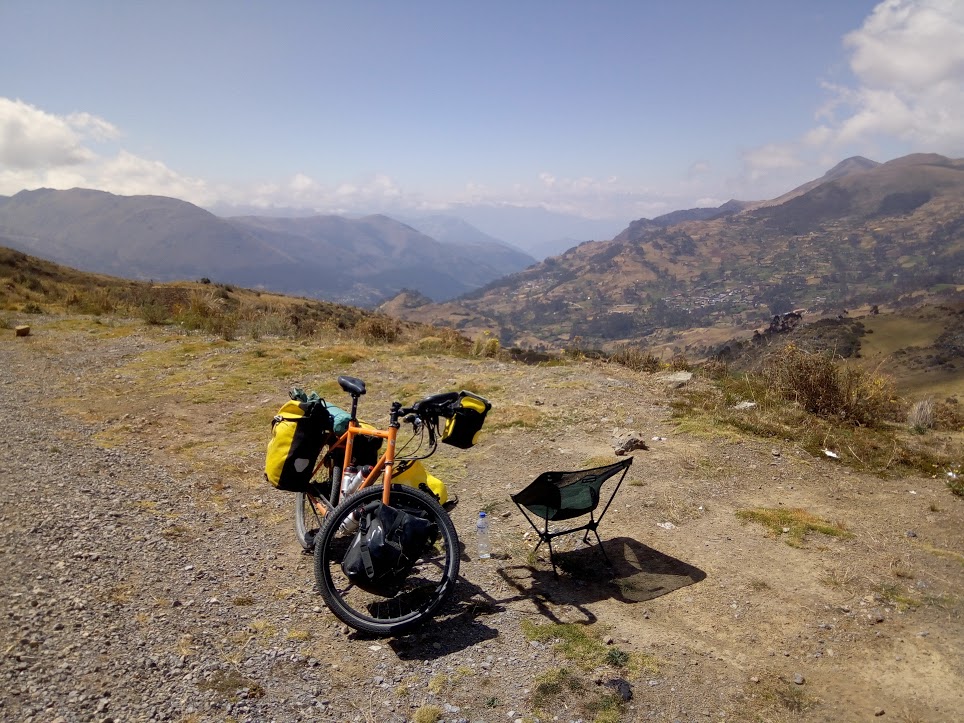
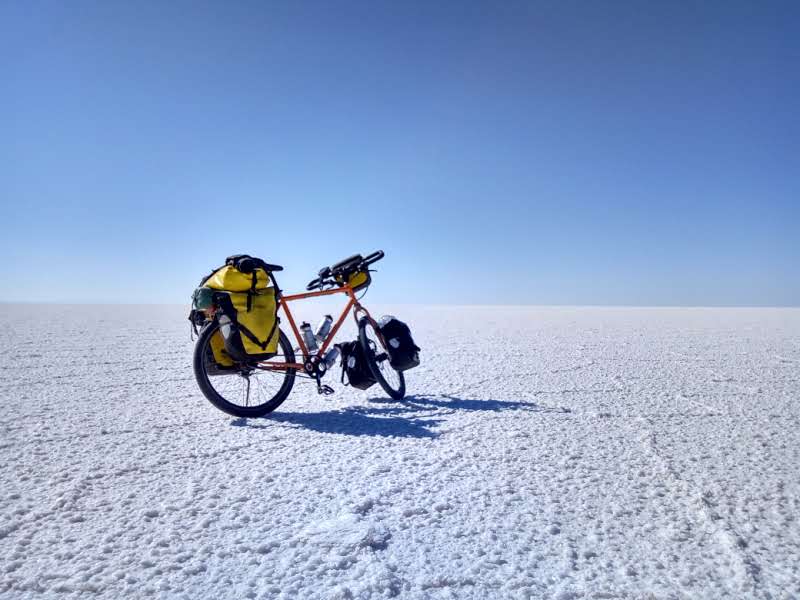 My father's bike in Peru (left) and the Bolivian salt planes (right). Copyright Patrick Descamps. All rights reserved.
I built a website to track my father’s progress as he is biking through the Andes from Ecuador to the very bottom of Argentina. He has a satellite phone that he uses to send a text message with his GPS coordinates, typically once a day. He also takes geo-tagged photos that are uploaded to Google Photos. Whereispatrick.at displays the coordinates of both the satellite phone and the geo-tagged photos (clustered by location). Thumbnails of the photos are shown when clicking on the photo markers. The website is private and used by friends and family members to follow the adventure. Tools used are:
-
Flask API and website.
-
Twilio to forward the Iridium GPS coordinate text messages to the Flask API.
-
Google Maps API to show the coordinates on a responsive map.
-
Google Drive API to automatically download the photos.
-
sklearn DBSCAN clustering algorithm to cluster photos that are taken close together.
-
Docker for testing and deployment on an AWS EC2 instance.
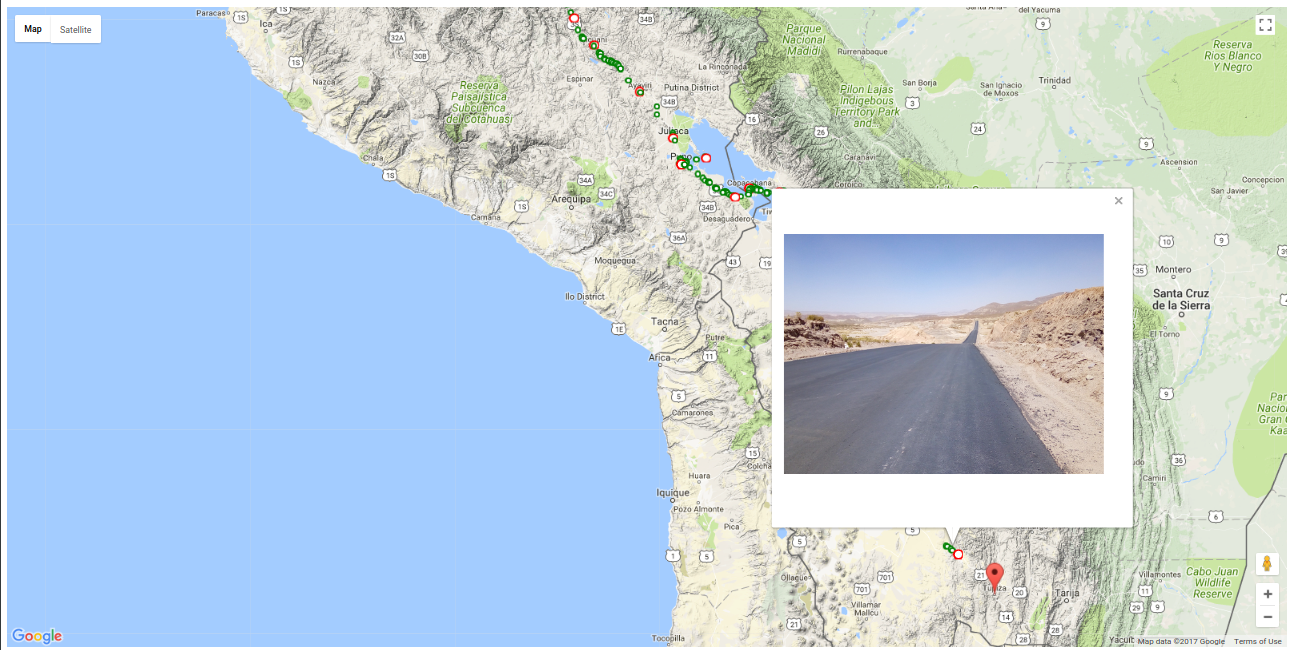
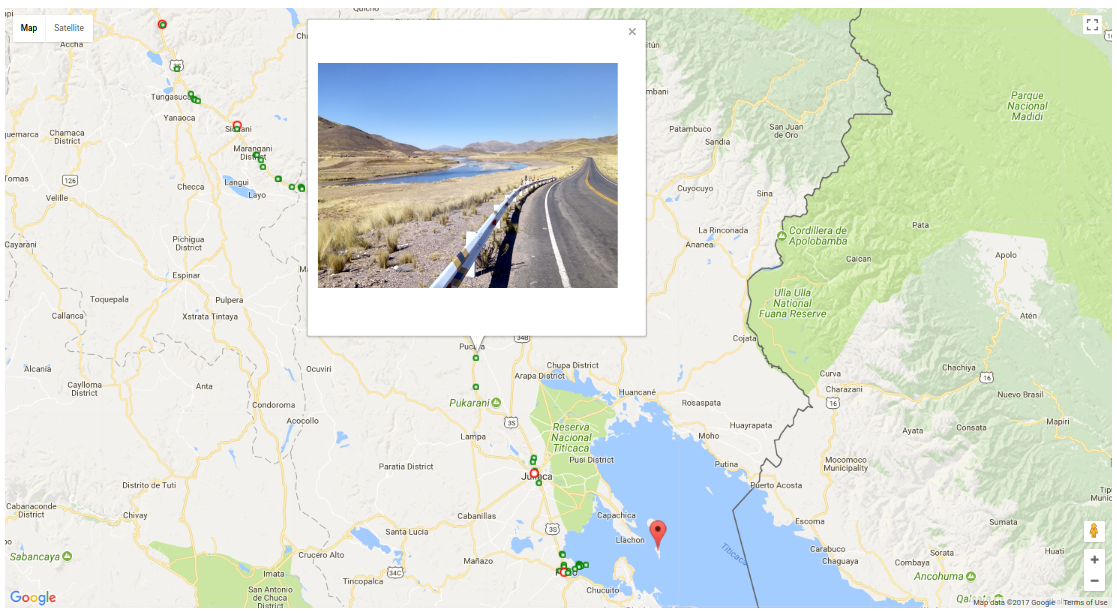 A screenshot from whereispatrick.at showing an InfoWindow of a photo-marker containing a photo thumbnail. The green circles show the location of the photo clusters, the red circles are historical coordinates from the Iridium satellite phone. The large red marker shows the last received Iridium coordinates.
Implementation details
The Iridium text messages
The Iridium satellite phone has a semi-automated system, where a text message with the current GPS coordinates can be send to a pre-programmed list of phone numbers. Here are some verbatim examples of the content of such a text message:
Lat- 1deg40'18" Lon-78deg39'01" Alt+2773 m (0s ago) 07-Jun-2017 22:50:34 UTC http://map.iridium.com/m?lat=-01.671866&lon=-078.650466
Lat-11deg31'16" Lon-75deg54'05" Alt+3728 m (2m20s ago) 09-Jul-2017 18:16:31 UTC http://map.iridium.com/m?lat=-11.521150&lon=-075.901583
Lat-16deg12'52" Lon-68deg40'59" Alt+3793 m (7m23s ago) 22-Aug-2017 19:05:28 UTC http://map.iridium.com/m?lat=-16.214583&lon=-068.683233
Side-note: he routinely bikes well above 3000m altitude! The links inside the messages are to an Iridium webpage that contains a Google Map with a marker at the location of the coordinates:
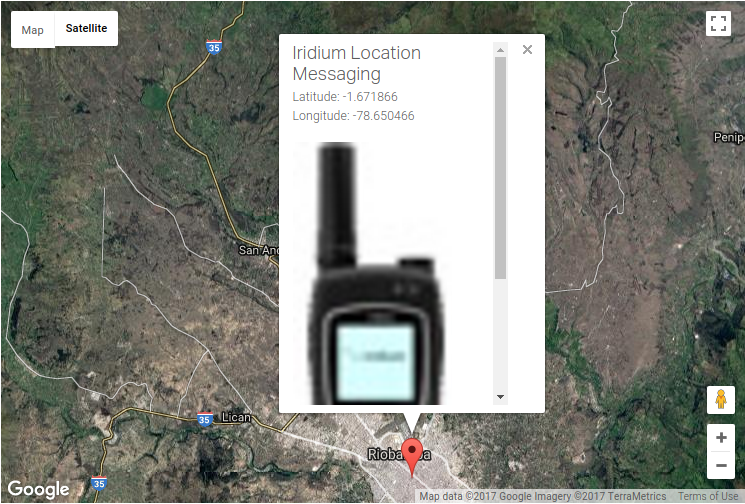
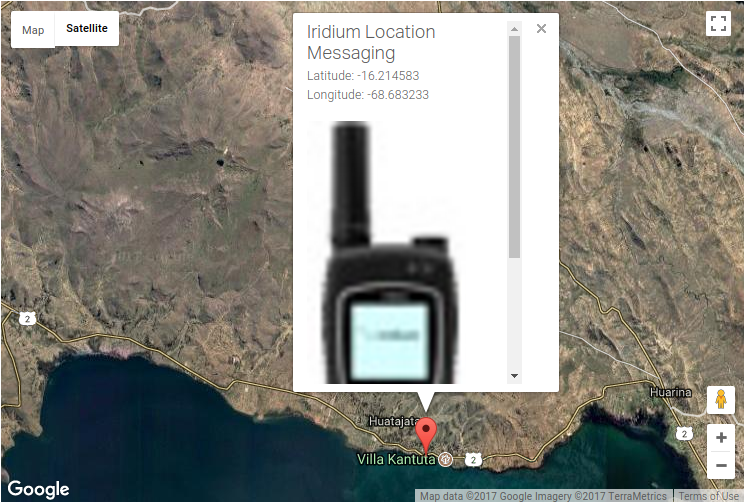
Two screenshots from the Iridium webpage showing the locations of the coordinates contained in the text messages.
Instead of having one map per GPS coordinate, I want to display all the Iridium coordinates on a single map to visualize the trip progress. Also, the information window, which opens when clicking on the marker, should display the date and the altitude instead of the coordinates and the strange Iridium phone thumbnail.
The first thing to figure out is how to access the content of the text messages in an automated way. This is where Twilio comes in.
Using Twilio to forward the text messages
Twilio allows, among other things, to programmatically receive (and send) text messages. Twilio offers a trial which includes 1 phone-number and a free balance (exact balance is unclear to me). See some details on the trial account here. Twilio has very nice documentation. Especially the tutorials and quickstarts are a great resource: https://www.twilio.com/docs/.
Setting up Twilio for whereispatrick
The steps are:
-
Sign up for a Twilio trial account and request a Twilio phone number. Instructions are here. There are two things to check for the phone number: that it is sms-enabled and that it is not limited to sending/receiving sms to domestic numbers only.
-
Enter the Twilio phone number on the Iridium satellite phone so that the text messages get send to it.
-
Tell Twilio what to do when a text message arrives. This is done via the Twilio website. From your console, go to the
Phone Numberstab. The configuration is then accessed by clicking on the number. In this case, the messages will be forwarded to the Flask API that parses the content to extract and store the coordinates. The screenshot below shows where to set this up in the Twilio console.
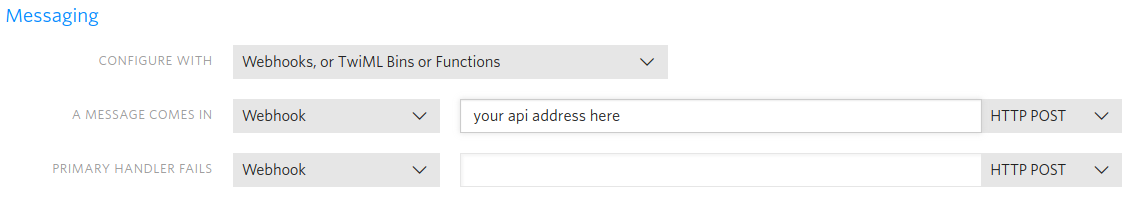
Screenshot of the Twilio configuration section for programmable sms.
Twilio console and costs
Once the messages start coming in, the Twilio Programmable SMS dashboard will display some statistics
and give access to the extremely useful debugger. Twilio will send out an email on the
1st, 10th, etc error of the day. The console also shows the costs under the Billing tab. No payment
is required under the trial account as long as the balance is not exhausted. It costs 0.0075$ per received SMS and 1.0$ per month for the phone number.
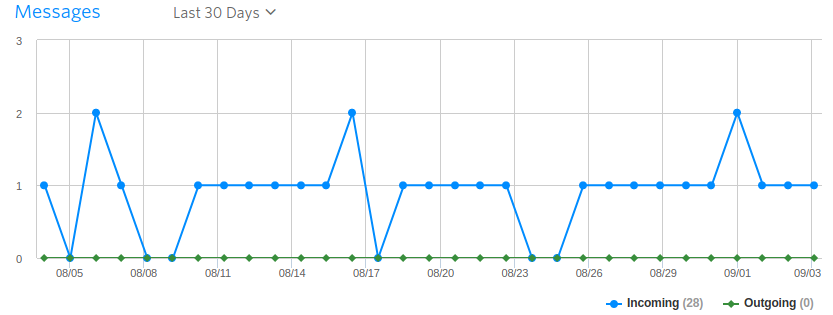
Partial screenshot of the Twilio Programmable SMS dashboard. It shows that my father sends 0-2 coordinates by sms per day.
Receiving the text message with Flask API
Quick reminder that the full code can be found on GitHub: https://github.com/Freija/whereispatrick. The Flask web API is a very simple API, with only one endpoint. When a message comes in, a parsing function attempts to extract the coordinates from the message. If successful, they are stored in a local CSV file. The Twilio twiml module is used to formulate the correct response.
Here is a very minimal example of the API:
from flask import Flask, request
import flask
import parser  # This is our app-specific module
import csv
from twilio.twiml.messaging_response import MessagingResponse

app = Flask(__name__)

@app.route("/api/coordinates/v1.0/", methods=['POST'])
def post():
    message = request.form['Body']
    # Use the parser module to extract the GPS coordinates from
    # the message.
    parsed = parser.parse_message(message)
    # Prepare an empty response message for Twilio.
    # This is needed to avoid errors on the Twilio server side.
    resp = MessagingResponse()
    if parsed != 0:
        # Add the coordinates to our local coordinates file
        with open(r'/data/coordinates.csv', 'a') as f:
            writer = csv.writer(f)
            writer.writerow(parsed)
        return str(resp), 200  # The request has succeeded.
    else:
        return str(resp), 500  # Internal server error.


if __name__ == "__main__":
    app.run(host="0.0.0.0", port=5000, debug=False)
The parser module (https://github.com/Freija/whereispatrick/blob/master/app/parser.py) has the code that extracts the coordinates from the text. It uses this monster of a regex expression, shout-out to regexr.com:
message_regex = re.compile(r'^'
                           r'Lat([0-9\s\-]+)deg(\d+)\'(\d+)\"\s'
                           r'Lon([0-9\s\-]+)deg(\d+)\'(\d+)\"\s'
                           r'Alt[+-](\d+)\s\w{1,3}\s'
                           r'\(.+?\)\s'
                           r'(\d{2}-[A-Za-z]{3}-\d{4}\s'
                           r'\d{2}:\d{2}:\d{2})\sUTC\s'
                           r'.+'
                           r'$')
The information contained in each text message is saved to the local CSV file in the following format (Iridium coordinate data-points), where the time is in UTC:
latitude             longitude           altitude  date
-2.5591666666666666, -78.93777777777778, 3132,     2017-06-11 20:47:33
-2.540833333333333 , -78.87222222222222, 3167,     2017-06-12 12:55:57
-2.9219444444444442, -79.01027777777777, 2685,     2017-06-13 18:27:21
Quick note on Flask-restful
Initially, I used the Flask-restful extension. However, it was not clear how to return the correct response. This meant that Twilio reported an error for every message, even if it was parsed correctly. Therefore, I switched to using the Flask request and Twilio twiml modules. This way, any error reported by Twilio is real (500 if parsing error, 404 if API is down, etc).
Downloading geo-tagged photos from Google Drive
My father takes geo-tagged photos (of some pretty amazing things) with his regular cellphone. These photos get uploaded automatically to his Google Photos account whenever he connects to wifi. However, Google Photos does not have an API. Initially, it seemed that there was no easy way to programatically access these pictures. Here is the work-around.
Start by setting up the Google drive from the same account to have a folder pointing towards the Google Photos. This is a setting in Google Drive: go to the Google Photos tab in the Google Drive, click on the settings icon in the top right corner. When you scroll down, you will see: Create a Google Photos folder Automatically put your Google Photos into a folder in My Drive. Make sure this is set. You will then see a folder inside Google Drive named Google Photos. Now, because Google Drive does have an API, you can access the photos through that folder.
The Google Drive API Python example is a great place to start, specifically to register the app and get the client ID and a client secret. More details on the authorization can be found here: https://developers.google.com/drive/v2/web/about-auth. Here are a few tweaks and tricks that I had to do for the whereispatrick project:
-
First, since this an app that will download photos from the drive, the scope needs to adjusted. In this case, I have just set the scope to
https://www.googleapis.com/auth/drive. This is full access. Writing this, I realize that this is likely too broad of an authorization and created a GitHub issue to look into testing thehttps://www.googleapis.com/auth/drive.readonlyscope. -
Second, since this app runs inside a Docker, we need to make sure that we can get the Oauth through the command line, this is done using the
--noauth_local_webserveroption.
In this case, I only had to get the authorization once. The resulting credentials are saved locally and shared with the appropriate docker containers. Once the authorization is in order, the photos can be accessed using the apiclient module, see images.py here: https://github.com/Freija/whereispatrick/blob/master/images/images.py. In that code, the images are downloaded and converted to a smaller thumbnail format using PIL. The full-sized images are then deleted. The GPS coordinates are part of the EXIF information. This is accessed using the piexif module. The piece of info we want is in the GPS section of the EXIF. This can be different for different camera models. In this case, this is the format of that info (example data):
{
  0: (2, 2, 0, 0),                          GPS tag version
  1: 'S',                                   North or South latitude
  2: ((11, 1), (52, 1), (261135, 10000)),   latitude
  3: 'W',                                   East or West longitude
  4: ((75, 1), (17, 1), (398785, 10000)),   longitude
  5: 0,                                     altitude reference level
  6: (3422, 1),                             altitude
  7: ((15, 1), (29, 1), (10, 1)),           time
  27: some crazy stuff,                     undefined data (?)
  29: '2017:07:12'                          date
}
The thumbnails are saved to disk and served from a separate nginx docker. The coordinates of the photo location and image name is saved to a local CSV file in the following format:
1,  IMG_20170716_160455.jpg,  -10.871571527777778,  -75.08304594444444, 582,2017-07-16 21:04:53
1,  IMG_20170716_141302.jpg,  -10.852666833333332,  -75.10791777777777, 891,2017-07-16 19:06:39
1,  IMG_20170716_125418.jpg,  -10.855616555555555,  -75.11288449999999, 766,2017-07-16 17:54:16
1,  IMG_20170716_160026.jpg,  -10.869841555555556,  -75.08080291666667, 584,2017-07-16 21:00:24
1,  IMG_20170716_113522.jpg,  -10.946722972222222,  -75.26346586111111, 723,2017-07-16 16:35:21
The first column tells us if we should plot these coordinates; images that do not have valid coordinates will not be plotted. The next columns are the image name, latitude, longitude, altitude and date. This file is also used at the time of the Google Drive download to check if we already have downloaded and processed a file. This last check is needed since there seems to be no clear order in which photos are uploaded from my father’s phone. In fact, some photos might appear many days after photos from the same date.
The Google Drive API allows for 1 billion requests per day, more than enough for me!
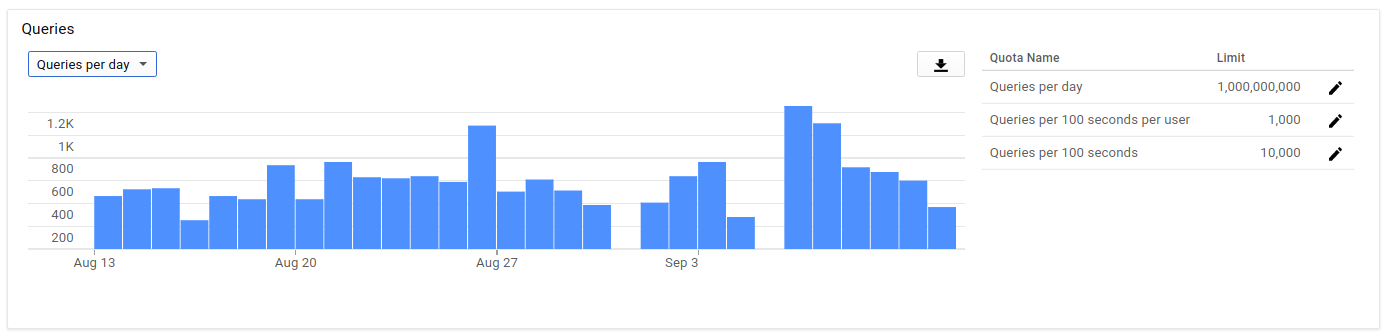
Partial screenshot of the Google Drive API dashboard showing the usage versus time.
Implementing photo clustering
In an earlier version of the website, each individual photo would have a marker on the map. However, this is not ideal. For example, for a museum visit, it is possible that many photos are taken relatively close together. One would need to zoom in a lot on the map in order to be able to distinguish and click on the individual photo-markers. The solution is to use a single marker per cluster of photos. I implemented a quick clustering function that uses the DBSCAN algorithm from scikit-learn. This blog post by Geoff Boeing was a great help!
The main advantage of the DBSCAN clustering algorithm is that it does not require the number of clusters as input. Clearly, we do not know how many photo-clusters might be in the photo-dataset and the number of clusters will grow over time. Another advantage of this algorithm is that it can handle noise. This means that it find clusters on top of a background of sparser data. In our case, there is no noise: all photos are part of a cluster, even if it is the only photo in the cluster.
The two main input parameters are (definitions from scikit-learn documentation):
-
min_samples: The number of samples in a neighborhood for a point to be considered as a core point. This includes the point itself.In our case, this input parameter will be 1: a photo can be alone in a cluster. -
eps: The maximum distance between two samples for them to be considered as in the same neighborhood.This defined the cluster size. It is an input to the clustering function in the app, and it is currently set to 100 meters.
The clustering function starts by retrieving all the available coordinates of the photos. The coordinates are given as latitude and longitude in degrees. The distance between two photos is calculated with the haversine function using radians as input. The eps variable therefore also needs to be in radians.
The DBSCAN algorithm returns a list of numbered clusters and the coordinates that are part of each cluster. Then, the centroid of each cluster is calculated: this is where the photo-marker for that cluster will be. The last step is to combine the cluster coordinates with the list of the associated photos. This is then saved to a local CSV file. Here are the first (1 photo) and second (3 photos) clusters, where the first column is the cluster number, the second is the coordinates of the center of the cluster and the last column is a list of the photos associated with that cluster:
1, "[-10.934536916666667, -75.19217680555556]",
   "[
     ['IMG_20170716_164718.jpg', -10.934536916666667, -75.19217680555556, 413, '2017-07-16 21:47:15']
    ]"
2, "[-11.033253423698437, -75.31624411811225]",
   "[
     ['IMG_20170716_103053.jpg', -11.033305166666667, -75.31606291666667, 735, '2017-07-16 15:30:52'],
     ['IMG_20170716_103012.jpg', -11.033273694444445, -75.31622313888889, 735, '2017-07-16 15:30:10'],
     ['IMG_20170716_102536.jpg', -11.033129666666667, -75.3166275, 906, '2017-07-16 15:25:34']
    ]"
In the current implementation, the date is not used to define clusters. This means that photos taken on the same location but on different dates will be part of the same cluster. That is acceptable for this application.
At this point, we have coordinates for the Iridium satellite phone messages and the clusters of photos. Time to plot these on a single map.
Plotting coordinates on single Google Map
The last step it to take the coordinates of both the Iridium satellite phone text messages and the geo-tagged photos (by cluster) from the Google Drive and plot them on a single map. whereispatrick.at is a small, private website and therefore the expected traffic is very low: not more than 50 loads per day. This is one of the reasons that I decided to use a map API: a lot of these have free tiers that are well within my requirements. There are multiple options for map APIs, two of which are Mapbox and Google Maps. I tried both and found Google Maps to be a bit easier to use and tweak to my wishes. The current version of the website uses Google Maps Javascript API. This API is free until exceeding 25,000 map loads per 24 hours. We should be safe! The following Google Maps tutorial walks you through how to get and use the API key: https://developers.google.com/maps/documentation/javascript/tutorial
From the html side, all that is needed is:
<div id="map"></div>
<script src="/index.js"></script>
<script async defer src="https://maps.googleapis.com/maps/api/js?key=<pass your key here>&callback=initMap"></script>
The Javascript in index.js is adapted from the Google Maps example: https://developers.google.com/maps/documentation/javascript/adding-a-google-map. It is as simple as loading the coordinates from the local CSV files and pass them on to the template. Then, a loop through the coordinates allows to create the appropriate markers and content for the information windows that open when clicking on the markers. We have three type of markers:
-
Historical Iridium/satellite markers. These are the locations of the previous coordinates as parsed from the Iridium text messages. When clicking on such a marker, an
Info Window(https://developers.google.com/maps/documentation/javascript/infowindows) shows the date and altitude associated with that marker. -
Latest Iridium/satellite marker. This is the location of the most recent Iridium text message that was received, in other words… the last known location of Patrick! The
Info Windowalso shows the date and altitude. -
Photo markers. These are the locations of the photo-clusters as extracted by the clustering algorithm. The
Info Windowshows the thumbnails of the photos associated with that cluster.
Another screenshot from whereispatrick.at showing an InfoWindow of a photo-marker containing a photo thumbnail.
Deployment and current status
whereispatrick.at has been live since the beginning of July 2017. The first version showed only the Iridium coordinates. The locations of the photos were added mid July 2017 and the photo-clustering was deployed on 16 August 2017. The website is deployed on an AWS EC2 instance using Docker. There are three docker containers, managed by docker-compose:
-
app: this is the Flask website and API. -
images: this is the module that checks for new photos on the Google Drive once every hour. It also re-runs the clustering algorithm every hour. -
static: an nginx instance to serve the photo thumbnails.
The containers all use the same data directory on the host, where the coordinate files and thumbnails live. This is the docker-compose that is part of the repository:
version: '2'
services:
  app:
    build: app
    image: "freija/whereispatrick"
    volumes:
     - "./data:/data"
     - "./config:/config"
    environment:
     - "STATIC_URL_BASE=http://localhost:8000"
  static:
    image: "nginx:alpine"
    volumes:
      - "./data:/usr/share/nginx/html:ro"
  images:
    build: images
    image: "freija/images"
    volumes:
      - "./data:/data"
For deployment on the server as well as for local testing, a docker-compose.override.yml is used to handle the necessary network details (exposing ports for local testing and Traefik details for the server).
Future ideas
Future enhancements are listed as issues to the GitHub repository: https://github.com/Freija/whereispatrick/issues. The next step is to implement the statistics page, which will contain:
-
Interesting graphs:
- Kilometers per day as a function of date.
- Altitude as a function of date.
- Number of photos taken per day as a function of date.
- …
-
Estimated time until completion.
-
…