Birdometer
Capturing and classifying hummingbird pictures
https://github.com/Freija/birdometer
Introduction
The local hummingbirds
Hummingbirds are pretty amazing. I am lucky enough to live in an area where they are common. The local resident is the Anna’s Hummingbird, but we can also find some Allen’s/Rufous Hummingbirds (notoriously hard to distinguish) for certain months of the year.
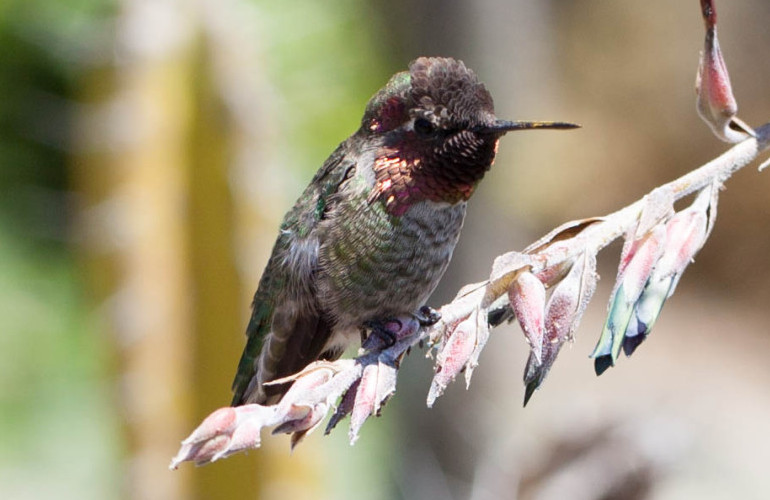
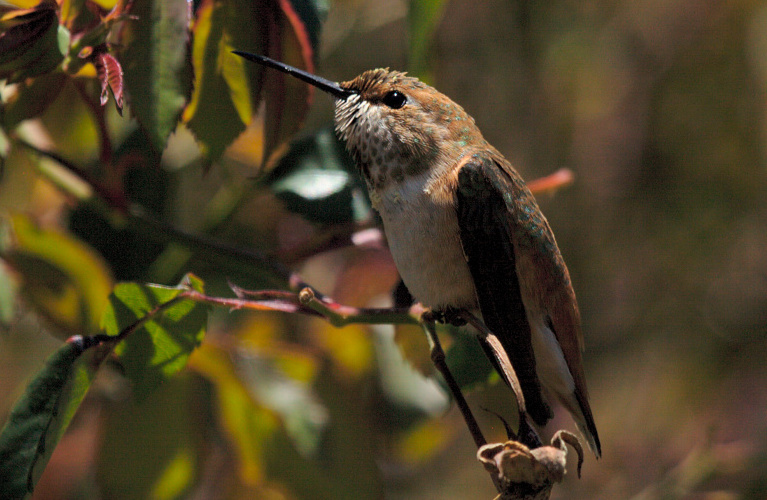 Anna's Hummingbird (left) and Allen's/Rufous Hummingbird (right). These pictures were taken with a DSLR camera, not the Birdometer. Copyright Freija Descamps. All rights reserved.
These hummingbirds are very small (7.6-10.9cm) and only weigh a few grammes. They live from drinking nectar from flowers and eating the occasional small bug, which they catch in flight.
What is the Birdometer
The Birdometer is a hummingbird feeder that I instrumented with a Raspberry Pi board with a connected Raspberry Pi camera and IR sensor. The Birdometer is currently set up to take 10 images whenever the IR sensor triggers. The Raspberry Pi code runs in a Docker. The code can be found here:
-
Raspberry Pi: https://github.com/Freija/birdometer-rpi
-
Image analysis with Python: https://github.com/Freija/birdometer-ml
The camera captures a top view of the birds as they are approaching and feeding. The camera alignment is done by aligning two marks: one on the feeder and one on the Birdometer. This alignment is not perfect and the location of the perch and feeding hole can change slightly from image to image. The orientation of the feeder itself does change compared to the ground, which means that the background can be different between different sets of images.
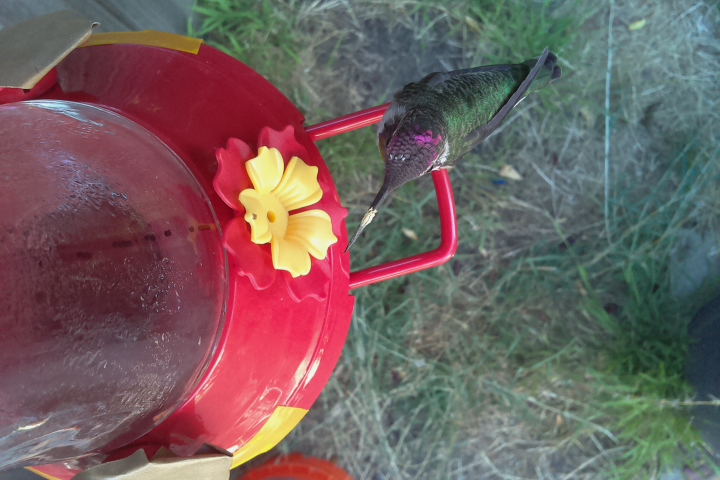
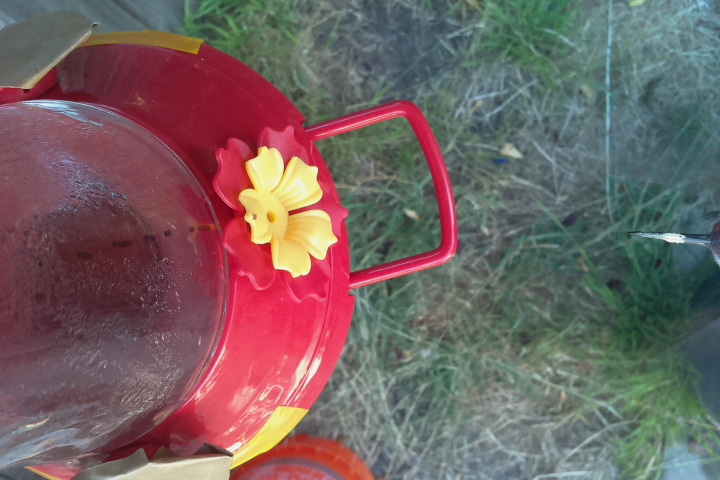
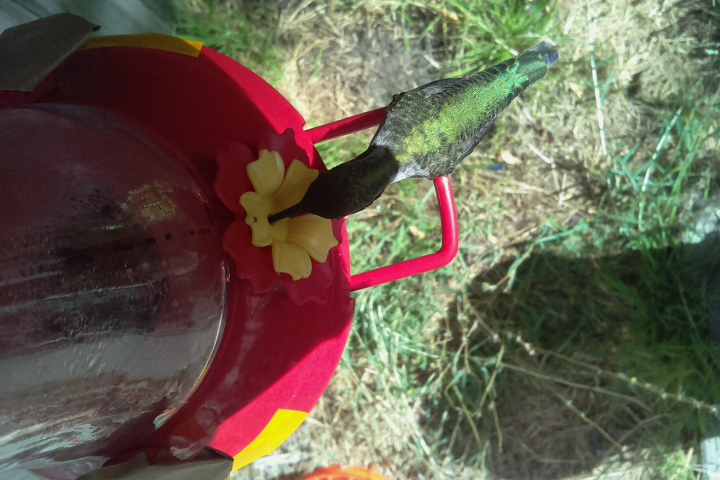
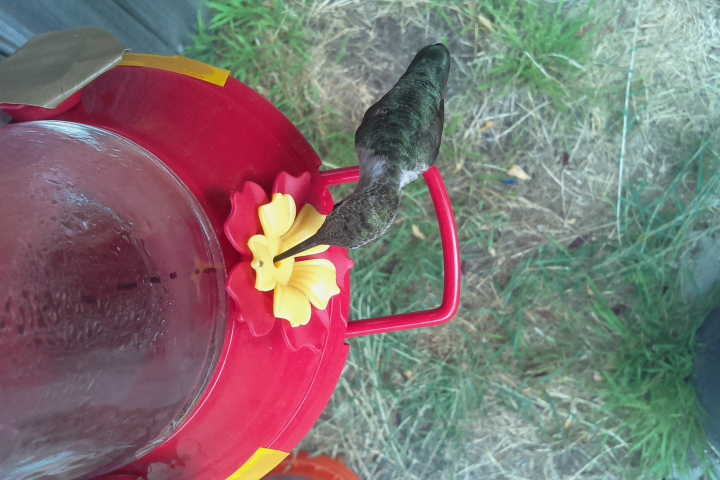 Two example Birdometer images showing two different birds, male (left) and female/juvenile (right) Anna's Hummingbird.
Goals
The first goal is to use the data to monitor the visits of the hummingbirds to the feeder, basically to record the time of each visit. This will allow us to potentially answer some interesting questions, like for example:
-
How often does a bird visit?
-
What times of the day are most popular?
-
Is there a correlation with temperature? Sun/rain/wind?
-
Is is possible to predict the number of visits for a particular day or other time metric?
The data will be displayed on a website (to be constructed) containing a bird time-line showing the time of each visit and also the associated images for each visit. Eventually, it would be cool to try to identify individual birds, see discussion of future ideas here.
Challenges
This section discusses some of the challenges that are currently being tackled or investigated.
False triggers
One of the initial challenge is to deal with the times that the IR sensor triggers without there being a bird in the camera field of view. I will call these false triggers and they lead to bird-less images. There are three types of (indistinguishable for each individual picture) false triggers:
-
The IR sensor is triggered by something other than a bird.
-
The IR sensor is triggered by a bird which stays outside the field of view of the camera.
-
The IR sensor is triggered by a bird which leaves too fast or enters too slow to be captured by the camera.
So clearly, we need to implement an image classification to tag images: bird or no bird. Then, only images with birds will be used in the final data-analysis and visualization. In fact, ideally, images without birds should not be saved to disk.
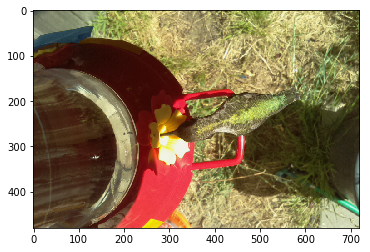
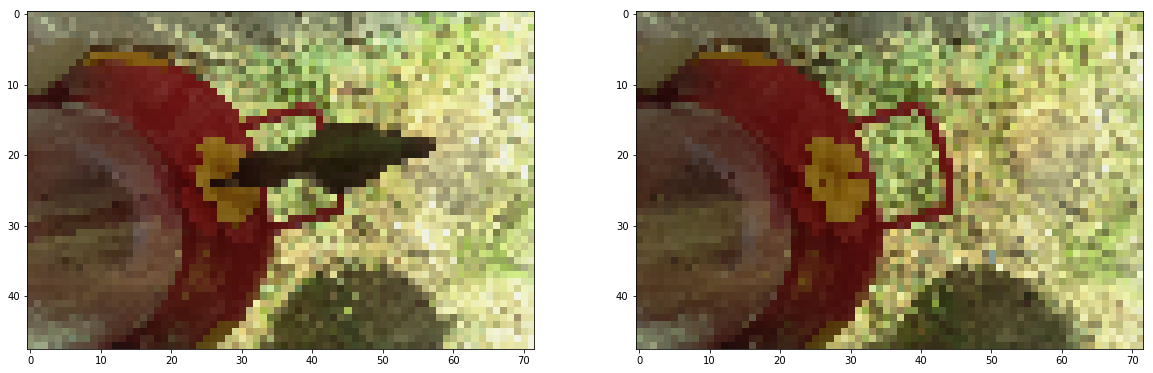
 Two example Birdometer images showing just the beaks of the visiting hummingbirds entering the image. Can you find the beak in the picture on the right? It is at the bottom close to the center. Should these images be classified as having a bird or not? Also note the differences in orientation and background between the two images.
False triggers/missed birds trade-off
One way to deal with the false triggers is to limit the field of view of the IR sensor itself. I have experimented with different shapes (cones, tubes, etc) that limit the sensor’s opening angle. This effectively reduces the false triggers. However, after some observation and testing, it became clear that this would lead to missed birds: occasions when a bird succeeds in feeding without triggering the sensor! That is much worse, in my opinion, than having to deal with a large number of false triggers.
Once we have the image classifier deployed on the Raspberry Pi, we can go to a continuous image-recording mode, only saving the images with birds to disk. The IR sensor signal can then serve as a tag rather than trigger.
Sun/shade differences
The feeder itself is located in a sunny spot of the garden. This causes the light to be very different at different times of the day. The hope is that it is possible to develop a classifier that is indifferent to this, but it is definitely something to keep in mind. It is possible to move the feeder or add shade to make the images more homogeneous if that turns out to be necessary.
Background differences
The orientation of the feeder relative to the ground is not controlled for. This means that the background can look very different between different set of images. If this turns out to be an issue, a plate can be mounted on the bottom of the feeder to provide a homogeneous and constant background. However, this will add weight and will make the feeder more susceptible to wind.
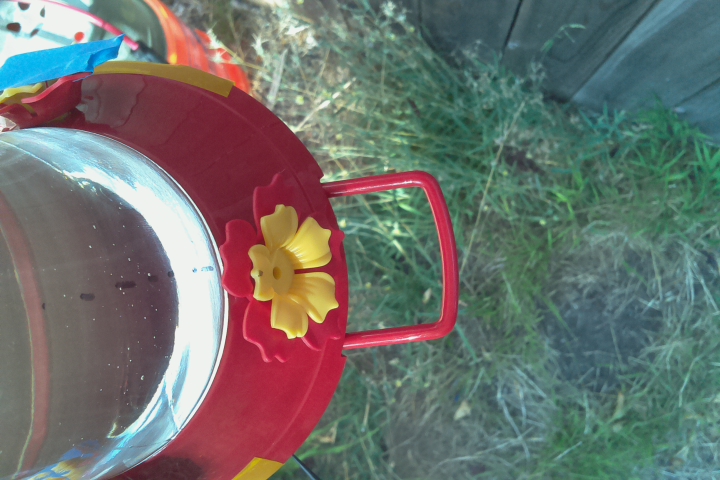
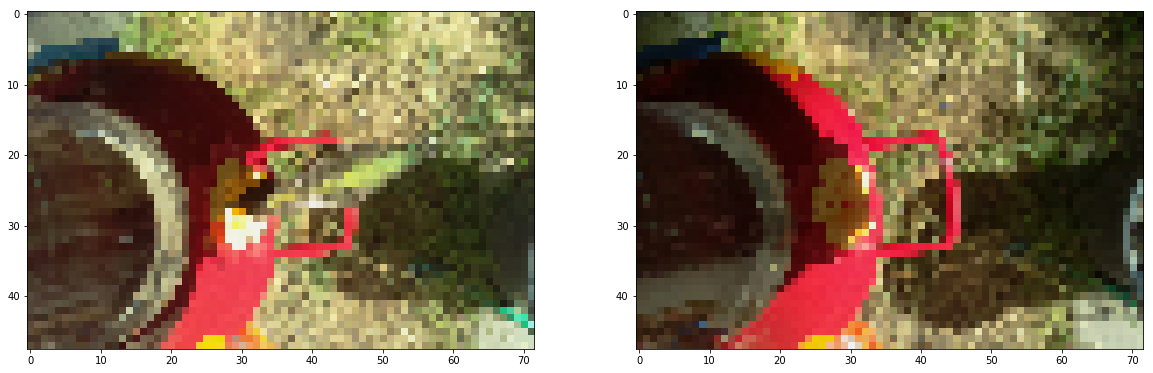
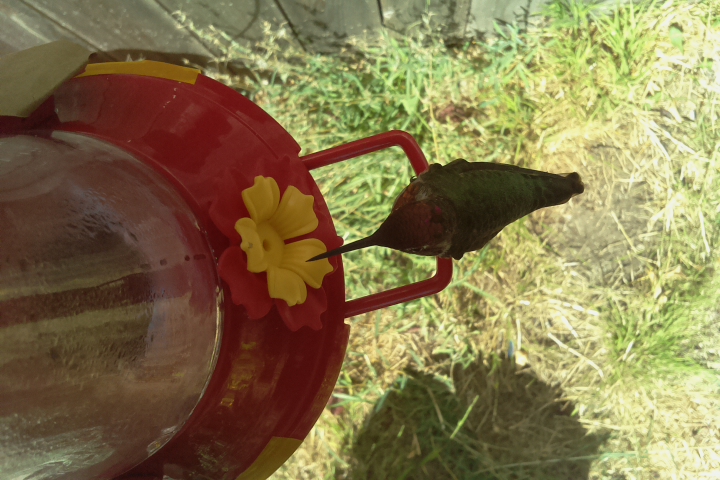 Two example Birdometer images illustrating differences in shade and background orientation.
Hardware
Currently, the Birdometer is powered through the Micro USB port using the standard adapter, plugged into an extension cord. This means that the unit is not wireless and I cannot currently leave it out overnight because of that. I’m investigating powering the unit through a combination of solar and battery power.
Also, the current prototype is not watertight and the raining season is coming up. I think it would be interesting to see the influence of rain and humidity on the feeding frequency. Therefore, I am designing a better electronics enclosure.
Image processing
Creating and understanding the labeled data-set
The first step towards creating the classifier (bird/nobird) is to manually label a set of images. This is done using a quick python script (handscan.py). The script loops over all images (jpg format) inside a directory. It also loads the CSV file that contains the labels that are already available. If an image has not been labeled yet, it displays the image using matplotlib.pyplot and asks on the command line if there is a bird or not. In addition, if there is a bird, it asks if the bird is drinking or not (beak in feeder hole). Finally it displays the answers and asks to confirm if they are correct. All answers are recorded as y/n in the CSV file behind the image name.
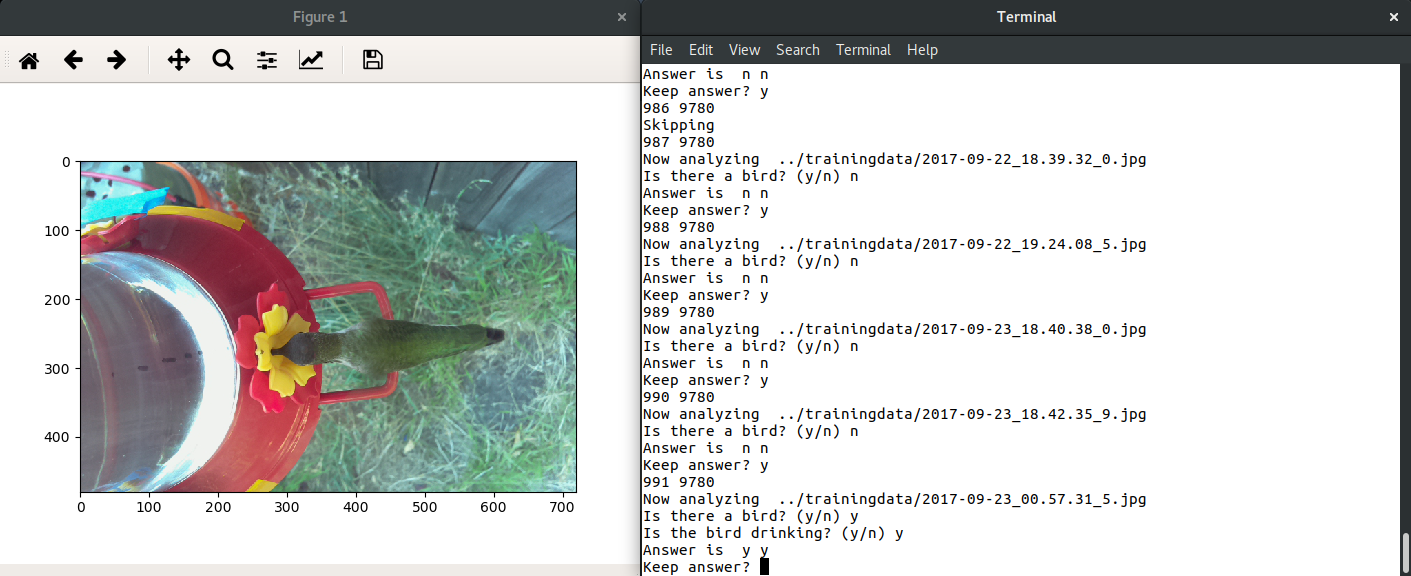 A screen-shot of the labeling process.
I labeled over 3800 images, excluding beak-only pictures (see the two example pictures in the False triggers section) from the bird-present group. It takes about 5 seconds per image. The current labeled set has (excluding invalid entries) 664 images with a bird (class 1), 3194 images without a bird (class 0) for a total of 3858 labeled images. It is clear that the labeled data has many more class 0 images than class 1.
The labeled data is then divided into a training set (80% or 2314 images), cross validation set (10% or 772 images) and test set (10% or 772 images). The cross validation set is used to compare different classifiers and different parameters for each classifier. The test set will be used after the classifier is fine-tuned to determine the expected precision of the classifier.
Image preprocessing
The images are 720x480 pixels RGB, this means that the maximum number of features is 1036800. The current pre-processing reduces this to 10368 by reducing the number of pixels but keeping the RGB information. The reduction factor is a parameter to the image processing code and can therefore easily be changed.
 Example of an original (left) and preprocessed (right) image.
Clearly, the preprocessed image above is very coarse and the color of the bird is similar as the background in most cases. The number of pixels can easily be tweaked in the future as part of the classifier optimization. Examples of things to try would be to increase number of pixels (increasing the number of features) and/or to cut away parts of the image that have the feeder and are not expected to contain useful pixels for the classification.
Image classification
Overview
The plan is to test out different classifiers algorithms to detect if there is a bird in the image or not. Currently implemented, as a baseline, is a kNN classifier using KNeighborsClassifier from sklearn. Next up are logistic regression, neural network and support vector machine.
Then, once the best classifier has been identified , I will train and use the test-set to understand the precision of the classifier. It will then be deployed on the Raspberry Pi to classify new images while in memory. The idea is to not save any image that does not have a bird. Depending on the performance, a continuous image-capture mode can be tested an implemented.
The current code can be found in the Jupyter Notebook here.
A closer look at the data
By doing dimensionality reduction, we can try to understand the data a bit better. Is there a clear separation between bird/non-bird pictures? If not, why not? What are the problem images and is there any other processing we can do to improve separation?
As a starter, a principal component analysis (PCA) uses a Singular Value Decomposition of the data to project it, in our case, to a two dimensional space. sklearn.decomposition.PCA is used to find the principal components and the first two principal components are plotted. The following snippet is adapted from the sklearn example. X_train and y_train are the features and labels (0 or 1) for the training set.
from sklearn.decomposition import PCA
pca = PCA(n_components=2, svd_solver='randomized',
          whiten=True).fit(X_train)
birds_pca = pca.transform(X_train)
# birds_pca is a NumPy array that contains the two components for each image.
# [[-0.91417182 -0.58942785], ..]
# The rest is basically just for plotting
colors = ["#27AE60", "#E74C3C"]
plt.figure(figsize=(15,5))
# Set the axes limits, accounting for the marker sizes as well
plt.xlim(birds_pca[:,0].min(), birds_pca[:,0].max() + 0.05)
plt.ylim(birds_pca[:,1].min(), birds_pca[:,1].max() + 0.2)
for i in range(len(birds_pca)):
    plt.text(birds_pca[i,0], birds_pca[i,1], str(y_train[i]), color=colors[y_train[i]])
plt.xlabel("pca1")
plt.ylabel("pca2")
Which gives the following result:
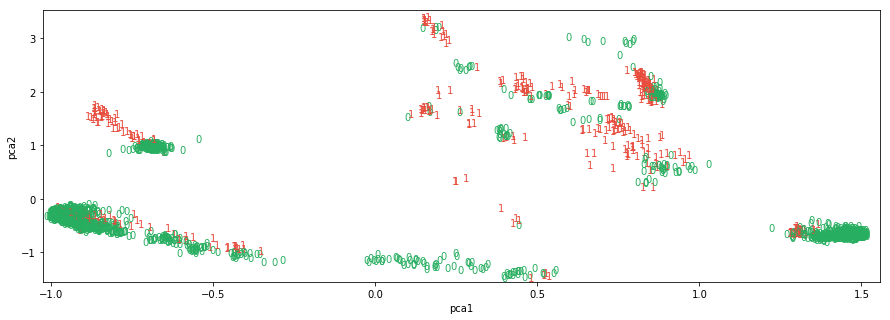 Plot showing the two components (pca1 and pca2) as extracted by the PCA algorithm. In green (red) are the images without (with) a hummingbird.
From the two-dimensional plot showing the two principal components above, it is clear that there are different clusters of images and within each cluster, both class 0 (no bird, green) and class 1 (bird, red) are represented typically. We can understand this as follows:
-
The images have differences in shading and contrast depending on whether the sun is out or on the time of day.
-
Each cluster is likely a cluster of images taken in similar lighting (time of day, shade, sun).
-
Within a group of images taken in similar conditions, there are images with and without birds.
Next, it makes sense to look at a few images to investigate. Specifically, there are two interesting groups:
-
group 1: pca1 < -0.5 and pca2 > 0.5. The classes are pretty well separated in this grouping.
-
group 2: pca1 > 1.0 and pca2 < 0.0. The classes seem less well separated in this grouping.
This following plot shows group 1 in blue and group 2 in purple.
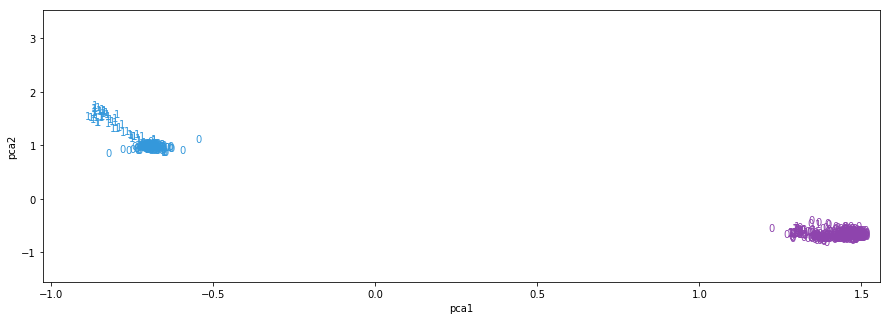 Plot showing the two components (pca1 and pca2) as extracted by the PCA algorithm. In green (red) are the images without (with) a hummingbird.
When looking through examples of both classes in this groups, it is clear that the shade and background play an important role in how well the classes can be separated. See examples below.
 Group 1 class 1 (left) and class 0 (right) typical examples.
 Group 2 class 1 (left) and class 0 (right) typical examples.
For group 1, there is a large contrast between the bird (in the shade) and the background (sunny). The distance in the (pca1, pca2) space is therefore larger than for group 2, where the contrast is minimal. A change to the hardware, assuring that the bird is always in the shade, can help in this example.
The next step is to implement different classifiers.
[This project page will be updated with more insights and results as they are being uncovered and produced.]
Current status
Hardware
The Birdometer itself is currently in the prototyping phase: I am trying out different ways to attach the devices to the Birdometer in a way that makes the alignments reproducible. The addition of additional sensors and cameras is under investigation.
Raspberry Pi software
The app is deployed on the Birdometer using Docker. The code itself is simple. The idea is to extend it to only save the images that have a bird once the classifier is trained and deployed.
Future ideas
Extending the Birdometer
Extend the Birdometer with additional sensors:
-
An acoustic sensor. Maybe wing beat speed (frequency) varies between different birds.
-
An interrupt sensor at the feeder-hole. This can be used as a trigger for additional images that can then be used for the identification of individual birds.
-
A load-cell. Measuring the weight versus time will give an idea of the nectar consumption over time. Combined with the interrupt sensor, we can estimate the consumption per visit or bird.
-
Additional cameras to add different angles.
Recognizing individual birds
One of the next things to try out is a kind of hummingbird facial/body recognition: can we distinguish between different individual birds? For this, adding the additional sensors (see above) will likely help.
Deploying additional Birdometers
It would be interesting to deploy the Birdometer at different locations and gather the data on a single webpage. Maybe we can identify the same individual bird visiting multiple feeders?