In the last post, Testing Google Vision API, the different ways to access the Google Vision API to label photos were discussed. As examples, some of the hummingbird images from the birdometer project were fed to the API. In this post, we will loop over all the images in the birdometer training set and collect the labels for each one.
The data-set
Here are two example birdometer images, each with a bird present.
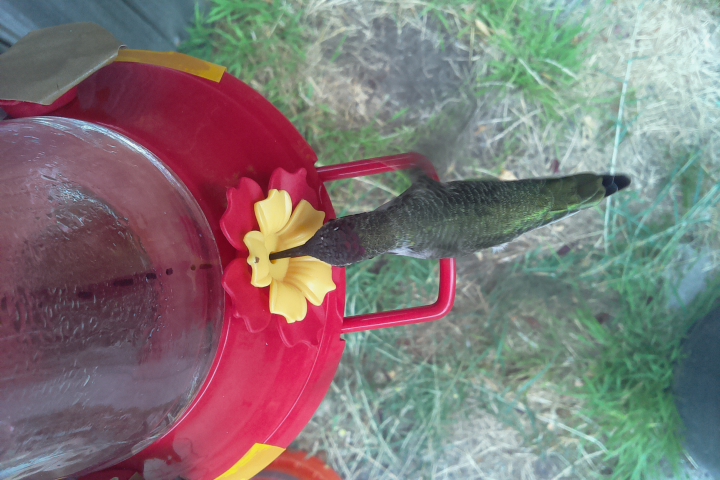
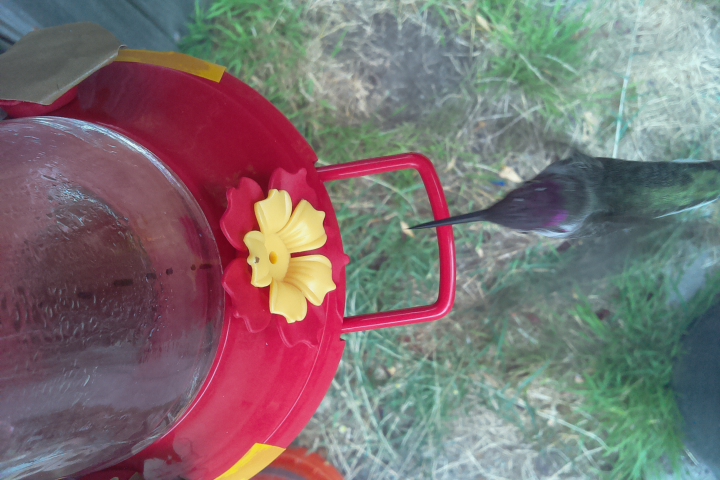
Birdometer images 2017-09-20_16.25.44_4.jpg (left) and 2017-09-20_16.25.44_1.jpg (right), used in the Google Vision API testing.
These images had the following labels assigned by the Google Vision API:
-
2017-09-20_16.25.44_4.jpg:
red, flora, flower, leaf, plant, grass, propeller -
2017-09-20_16.25.44_1.jpg:
flora, leaf, grass, flower, plant
During testing, it became clear that some images that contain birds, do not actually receive any bird-related labels. This is likely due to the low contrast between the green background and the green birds as well as the unusual top-view angle at which the images are recorded.
The hand-classified data-set contains (excluding invalid entries) 664 images with a bird (class 1), 3194 images without a bird (class 0) for a total of 3858 classified images.
Results
All hand-classified images were then also labeled by the Google Vision API, using a quick Python script based on the code discussed the the last post (Testing Google Vision API). This script:
-
Loops over all hand-classified images.
-
Contacts the Google Vision API for each image (that has not been processed yet) to request annotation.
-
Stores the labels and classification in a local CSV file.
This resulted in 54 unique labels overall: 43 for the class 1 images (bird) and 33 for the class 0 images (no bird). There is significant overlap in labels between the two classes as we can expect from images that are so similar. The images with the birds have a larger variety of labels. This is also expected, since there is an additional element (bird) present. Using the Python wordcloud library and excluding the two most common labels: grass and plant, two wordclouds are created: for the images with and without a bird. Each wordcloud shows all labels, the font size represents the frequency the label was assigned. The code can be found in the Google Vision API Jupyter notebook.
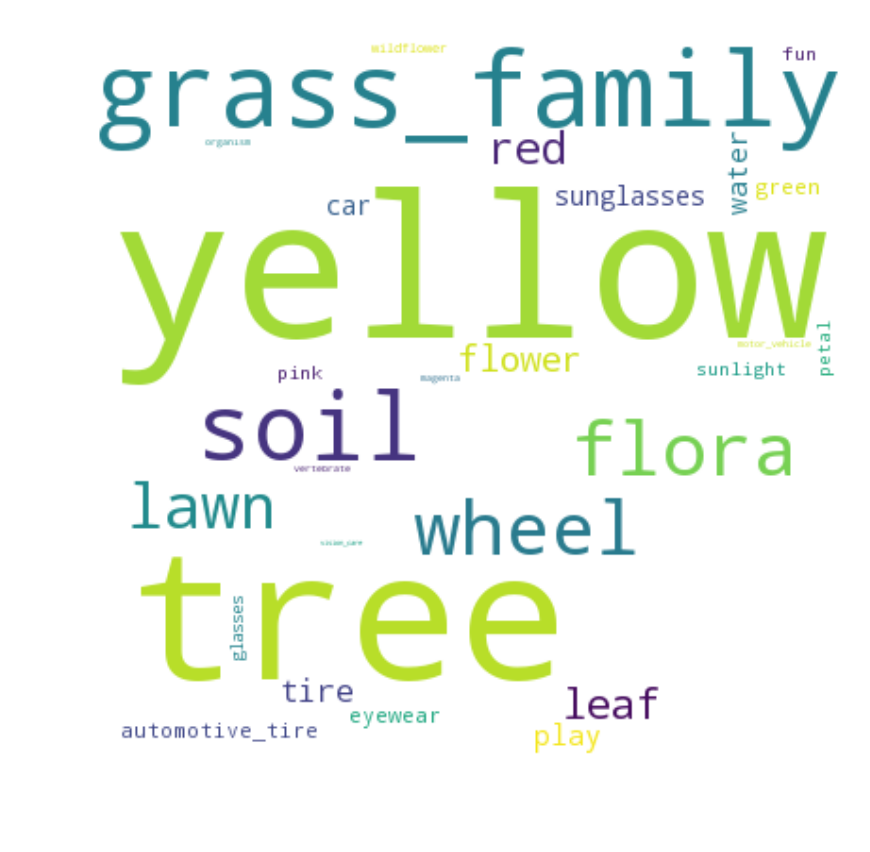
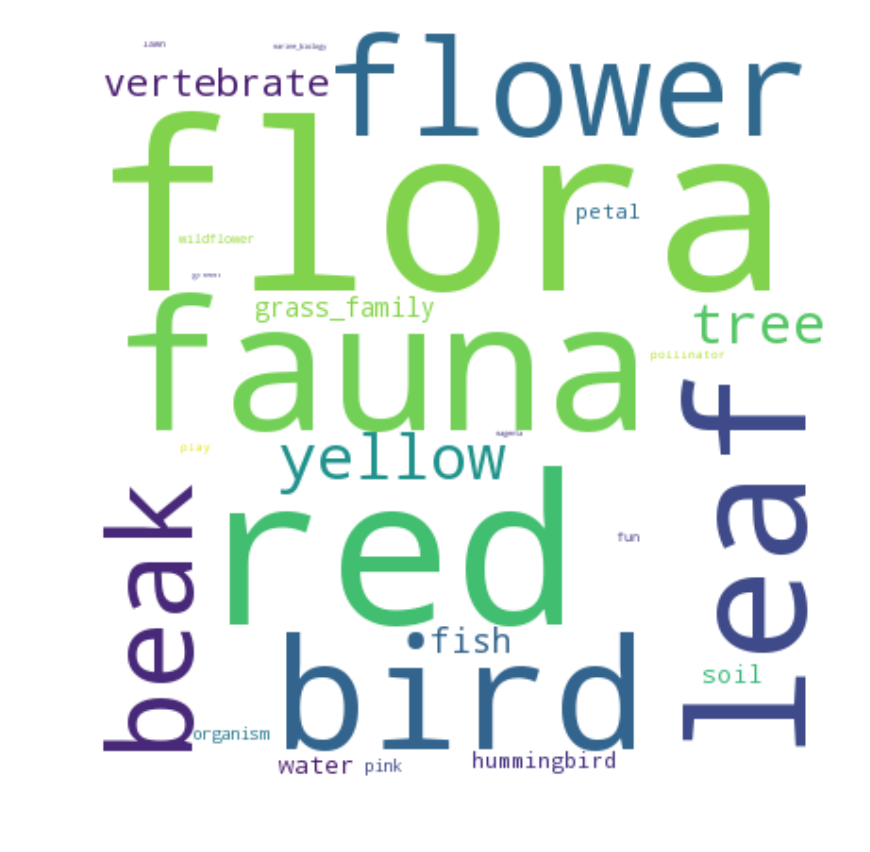
Wordclouds for the classified Birdometer images without (left) and with (right) a hummingbird present in the image.
The ‘fauna’ and ‘bird’ labels do not show up for the class 0 images, whereas they do for about 44.5% and 34% of the class 1 images respectively. The current method does not make use of the probabilities that the Google Vision API assigns to each label. It would be interesting to incorporate those as weights. Next up, we can use the labels of the training set to train a classifier, to be continued.
Below are all 54 unique labels with their respective frequency that they were returned for the class 0 and 1 images (percentage of images with that label). Table generated using the Google Charts API. Click on column name to order by that column. I think personal_protective_equipment might be my favorite label so far!